Notice: Function _load_textdomain_just_in_time was called incorrectly. Translation loading for the jetpack domain was triggered too early. This is usually an indicator for some code in the plugin or theme running too early. Translations should be loaded at the init action or later. Please see Debugging in WordPress for more information. (This message was added in version 6.7.0.) in /home/urbanana/public_html/wp-includes/functions.php on line 6114

Warning: Cannot modify header information - headers already sent by (output started at /home/urbanana/public_html/wp-includes/functions.php:6114) in /home/urbanana/public_html/wp-includes/feed-rss2.php on line 8
urban wealth disparities – Urban Analytics Institute https://urbananalyticsinstitute.com Tue, 28 May 2019 18:10:02 +0000 en-CA hourly 1 https://wordpress.org/?v=6.7.5 https://urbananalyticsinstitute.com/wp-content/uploads/2024/08/cropped-1-1-modified-removebg-preview-150x150.png urban wealth disparities – Urban Analytics Institute https://urbananalyticsinstitute.com 32 32 Housing affordability is getting worse even though prices are falling. How is that possible? https://urbananalyticsinstitute.com/housing-affordability-is-getting-worse-even-though-prices-are-falling-how-is-that-possible/ Tue, 28 May 2019 17:01:43 +0000 https://urbananalyticsinstitute.com/?p=155 Haider-Moranis Bulletin: Housing affordability only partially depends on prices. Regulatory changes, such as the stress test and mortgage rates, play a large role, too.

Conventional wisdom states that falling prices should improve housing affordability.

Though the logic is appealing, Canadian housing markets paint quite a different picture, with housing affordability worsening even though average housing prices have fallen.

Unlike many other assets classes, housing markets are complex and heterogeneous, with no two homes (or buyers) being identical. As a result, the housing market does not necessarily follow the typical wisdom of markets.

Recent housing market data and research reveal that affordability eroded in Canada even as prices have tumbled. The reason for this anomaly is that housing affordability only partially depends on prices. Regulatory changes also play a large role in determining housing affordability.

A report by RBC Economic Research reviewed housing affordability in the third quarter of 2018 and concluded that it was “getting less affordable to own a home in Canada.”

The report tracks the income required to cover the cost of owning an average home with a 25 per cent down payment. When compared with the third quarter of 2015, the qualifying income had increased significantly by the third quarter of 2018.

In Vancouver, for instance, the income required to cover ownership of an average home was $211,000 in 2018, up from $127,000 three years ago. The qualifying income in Toronto was $187,000 in 2018 compared to $103,000 in 2015. In fact, the qualifying income had increased in all large and small housing markets across Canada.

One big reason for the higher qualifying income required in 2018 was the increase in housing prices since 2015, a rise that was most pronounced in Greater Vancouver and Toronto.

Qualifying incomes, therefore, increased by $34,000 in Vancouver and $27,000 in Toronto since 2015 as a result of higher prices, the RBC report estimated.

But rising prices were not the only factor. Even without their impact, the qualifying income would have climbed considerably because of the stress test that required the borrowers to qualify at a higher interest rate than the contracted rate as of January 2018.

The RBC report estimated that the increase in qualifying income due to the stress test was almost the same as the one resulting from the increase in housing prices.

The stress test raised the qualifying income threshold by $36,000 in Vancouver and $27,000 in Toronto.

pastedGraphic.png

Recent housing market data and research reveal that affordability eroded in Canada even as prices have tumbled. Tyler Anderson/National Post files

It also didn’t help that mortgage rates also increased over the same period further raising the bar to qualify for home ownership.

The RBC Economics Report illustrates the peculiarities of housing markets where price alone does not determine the affordability of an asset. Certainly, the increase in housing prices eroded affordability. However, equally instrumental were the regulatory changes (stress test and mortgage rates) that also erected huge affordability barriers.

The impact of the stress test is further illustrated with data from Toronto where housing prices rose sharply from 2015 to the first quarter of 2017. Toronto’s housing market experienced two regulatory shocks. The first shock came in April 2017 when the Ontario government imposed new taxes on foreign homebuyers. The immediate impact was a decline in sales and prices. The second shock came in January 2018 when the stress test was imposed.

Toronto’s sales data reveals that the share of the market taken up by the least expensive homes (those sold for less than $400,000) declined as housing prices increased.

For instance, 30 per cent of the homes sold in 2015 transacted for less than $400,000. By the first quarter of 2017, when housing prices peaked, the share of low-priced homes accounted for a mere 12 per cent of the transactions.

As the housing prices slid in Toronto as of May 2017, the share of homes that transacted for less than $400,000 increased slightly and represented 13 per cent of the total transactions for the rest of 2017.

However, the share of low-priced homes in 2018 declined from 13 to 9 per cent (a 31 per cent drop), which took place even when the nominal average home price in Toronto declined from $822,681 in 2017 to $787,300 in 2018, and $766,197 in February 2019.

Again, the conventional wisdom would have dictated an increase rather than a decline in the share of low-priced homes that attract low- to moderate-income households. But that didn’t happen.

The stress test and the increase in mortgage rates increasingly affected the affordability of low-income households and priced them out of the market even when house prices were declining.

Housing affordability will improve with a decline in home ownership costs, which will require regulatory changes in the short run and greater housing supply in the long run.

Disclaimer and Acknowledgements: This blog post has been reproduced, with thanks, from The Financial Post’s Haider-Moranis Bulletin, courtesy of Murtaza Haider and Stephen Moranis, published on March 13, 2019.

Murtaza Haider is an associate professor at Ryerson University. Stephen Moranis is a real estate industry veteran. They can be reached at www.hmbulletin.com.

]]>
How housing is helping immigrant families close the wealth gap https://urbananalyticsinstitute.com/how-housing-is-helping-immigrant-families-close-the-wealth-gap/ Mon, 22 Apr 2019 23:48:36 +0000 https://urbananalyticsinstitute.com/?p=97 Haider-Moranis Bulletin: For immigrant families, housing alone has been the primary driver of wealth growth

The recent slump in real estate sales and prices in Canada has led some to question whether housing remains a good investment. For immigrant families in Canada, the stakes may be particularly high.

That’s because new research from Statistics Canada shows that investment in housing by immigrant families has been a major factor in helping them plug the wealth gap that exists between them and their Canadian-born compatriots.

Whereas the study found wealth growth for Canadian-born families has in recent years been driven both by increases in housing and registered pension plan assets, for immigrant families, housing alone has been the primary driver of wealth growth.

René Morissette, a senior economist with Statistics Canada, in a report released this week used data from several waves of the Survey of Financial Security to compare the wealth growth of immigrant and Canadian-born families. The designation of a family being immigrant or otherwise was based on the immigration status of the major income earner.

The report generated synthetic cohorts in order to compare similarly structured immigrant and Canadian-born families over time. The benchmark cohort comprised recent immigrant families whose primary income earner in 1999 was 25 to 44 years old and had been in Canada for fewer than 10 years. The other cohort comprised established immigrant families whose primary income earner in 2016 was 42 to 61 years old (on average 17 years older relative to 1999) and had been in Canada for 18 to 26 years. The comparable Canadian-born cohorts were of the same relative age groups.

Interestingly, while immigrant families started at lower rates of home ownership in 1999, by 2016 the homeownership rates between comparable immigrant and Canadian-born families converged.

On average, 31 percent of the benchmark cohort of recent immigrant families in 1999 owned a principal residence compared to 56 percent of comparable Canadian-born families. By 2016, established immigrant families led by a primary earner of 42 to 61 years of age reported a homeownership rate of 78.7 percent compared to 74 percent for their Canadian-born counterparts.

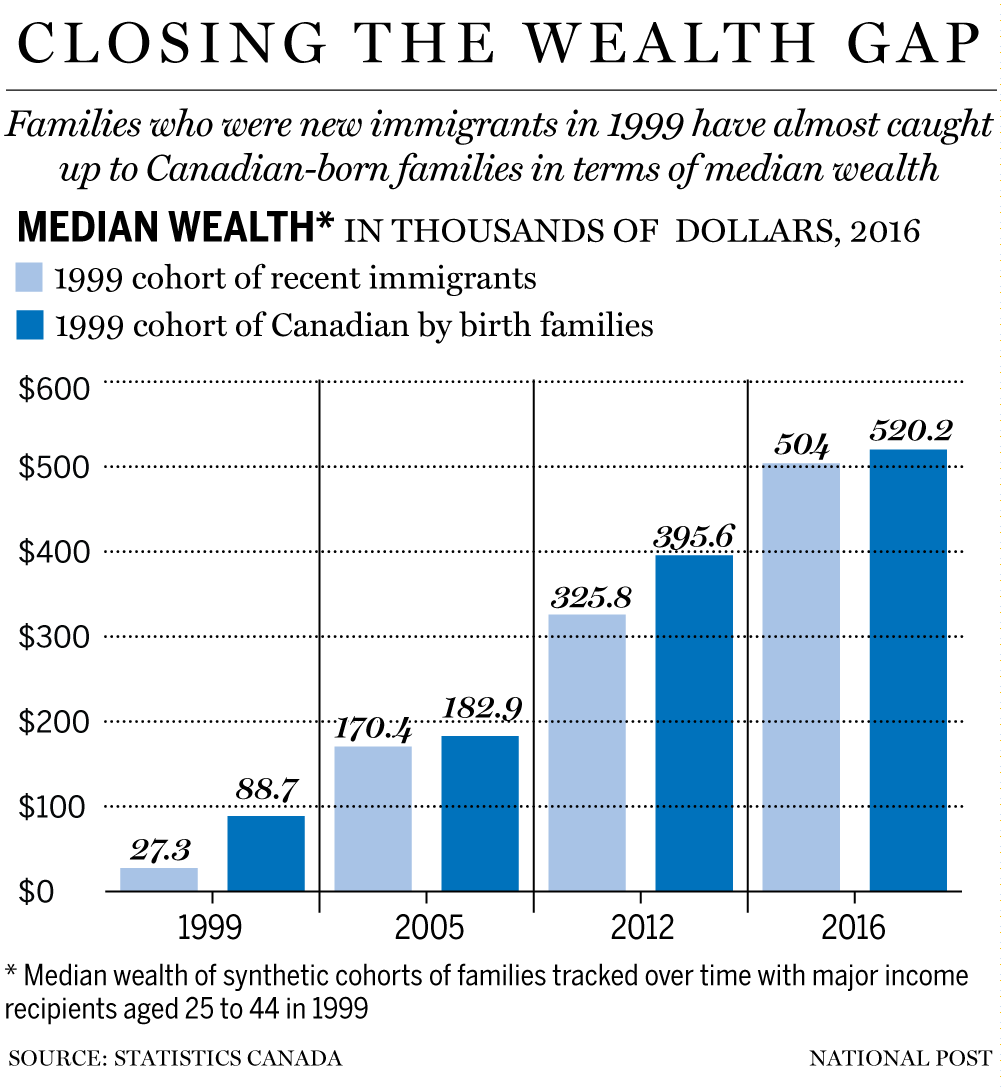
A key finding of the report is how the immigrant families caught up to their Canadian-born counterparts in growing wealth over time. In 1999, the median wealth of Canadian-born families with the major income earner aged 25 to 44 years old was 3.25 times higher than that of comparable recent immigrant families. However, when the two synthetic cohorts were compared 17 years later, the difference in median wealth between the immigrant and Canadian-born families almost disappeared.

Canadian-born and immigrant families relied on different asset classes for wealth growth. The wealth composition of families in 2016 revealed that housing equity explained about one-third of the average wealth of Canadian-born families. By comparison, housing equity was responsible for a much larger share of immigrant families’ wealth, accounting for anywhere between one-half to two-thirds.

The wealth growth observed for immigrant families has a side story of high indebtedness. The report found that in 2016, immigrant families, in general, had “markedly higher debt-to-income ratios than their Canadian-born counterparts.”

Immigrant families often, but not always, are larger in size. This is partly because immigrants are more likely to live in multi-generational households or to have siblings and their respective families occupy the same dwelling.

The unit of analysis in Statistics Canada’s report is economic family, which “consists of a group of two or more people who live in the same dwelling and are related to each other by blood, marriage, common law or adoption.” An economic family may comprise of more than one census family.

The expected differences in family size and structure between immigrants and Canadian-born families could have influenced some findings in the report. For example, the family wealth held in housing by immigrant families might lose its significance when wealth growth is compared at a per capita basis.

Housing is more than just an asset class. Homeownership provides shelter and the opportunity to grow equity over time. Canadian data shows that rising home prices over the past two decades has helped immigrants bridge the wealth gap even when the gap between the average incomes of immigrants and Canadian-born has persisted.

Disclaimer and Acknowledgements: This blog post has been reproduced, with thanks, from The Financial Post’s Haider-Moranis Bulletin, courtesy of Murtaza Haider and Stephen Moranis, published on April 18, 2019.

Murtaza Haider is an associate professor at Ryerson University. Stephen Moranis is a real estate industry veteran. They can be reached at www.hmbulletin.com

]]>